
After the shocking scoreline between Atletico and Real Madrid last week, I thought it would be interesting to see how likely each scoreline is.
For this purpose, I extracted the scorelines from the last 7 seasons (2007 to 2014) for Spanish, Italian, German, French and English top divisions.
The data comes from the data set described in the first football article (from Soccerway.com and Football-Data.co.uk). The code I used is on Github.
Results frequencies
Let’s take a first look at the frequency of each result: home win, draw or away win.
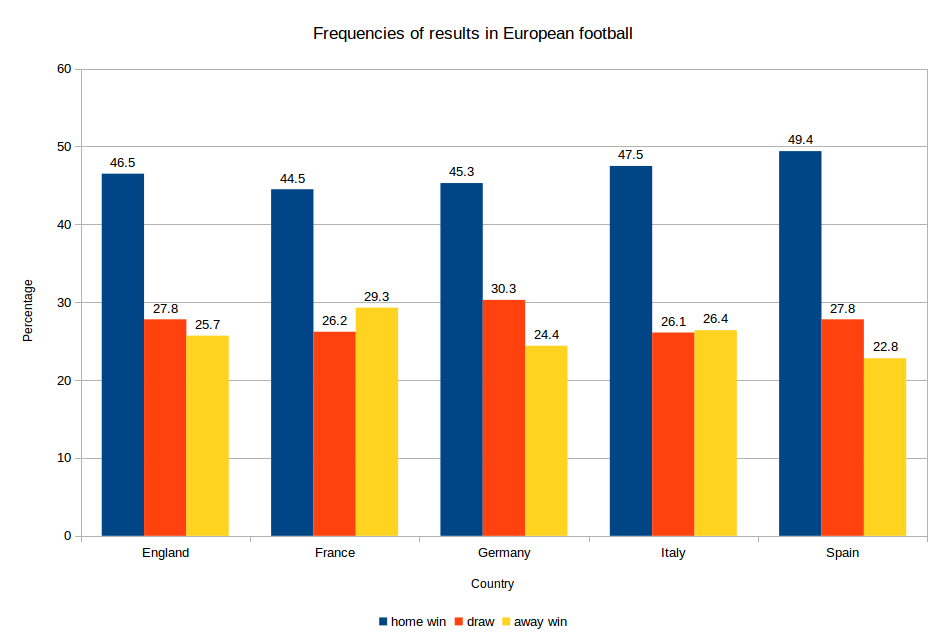
Whatever league we choose, the home side seems less likely to lose than the away side, and home wins are the most common outcome. All charts are similar, but we can identify some interesting trends:
- Home advantage seems stronger in Spain than in other countries: less than 23% away wins.
- Home advandage seems weaker in France than in other countries: more than 29% away wins.
- There are more draws in Germany than in other countries: more than 30% draws.
Scorelines frequencies
After having seen the results, let’s have a look at each specific scoreline.
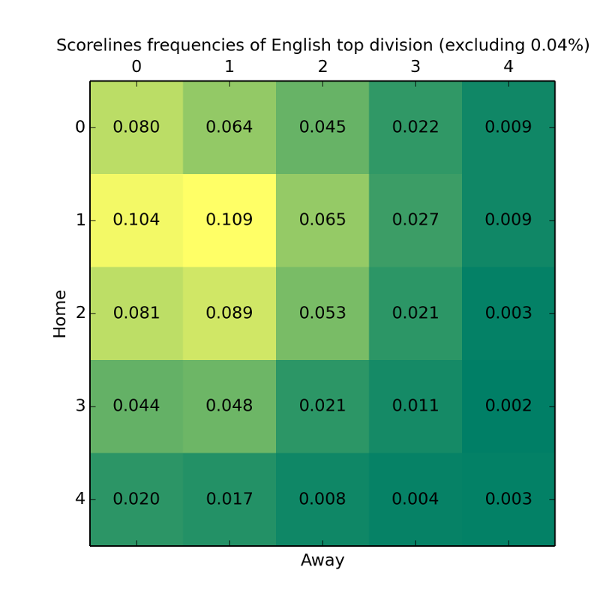
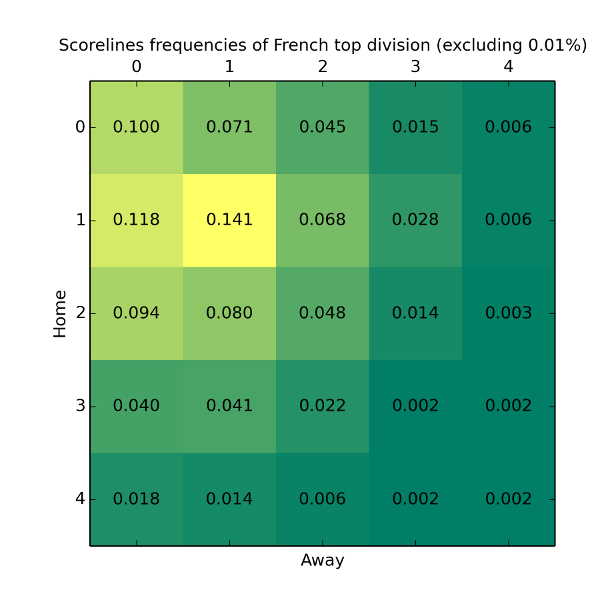
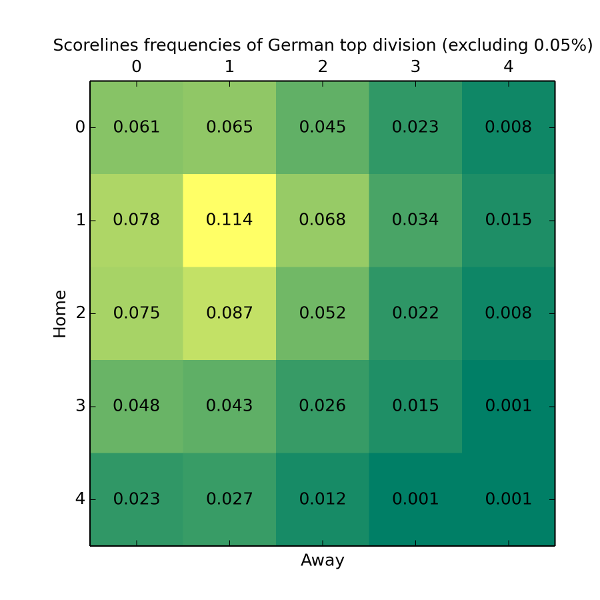
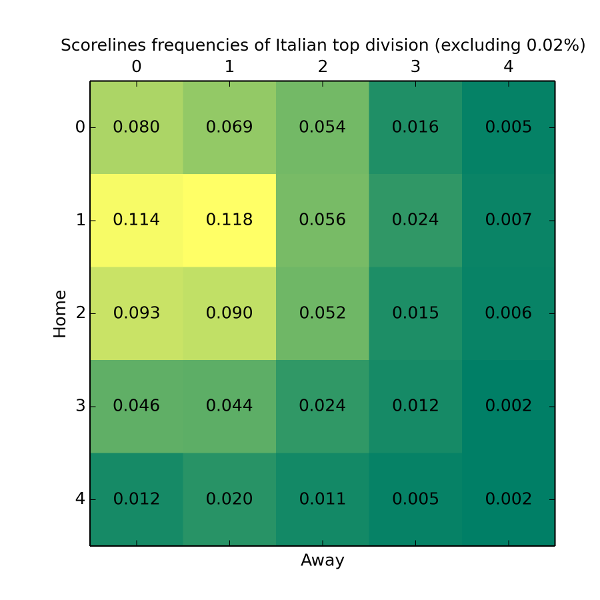
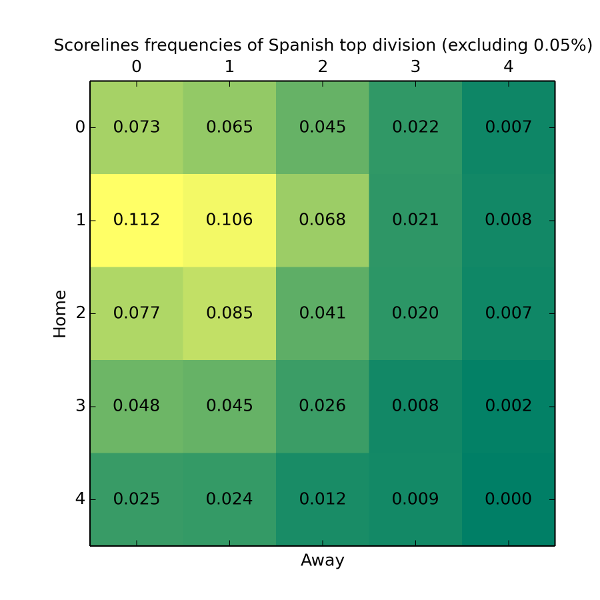
We see that scorelines featuring less than two goals are more common than exotic scorelines. The more exotic the scoreline, the less likely it is.
We see that the scorelines are quite different according to the league we consider. For example:
- There are more 0-0 in France than in other countries.
- In Italy, Germany, France and England, 1-1 is the most common scoreline. In Spain, it’s 1-0.
Caveat
As you can see, I didn’t spend a lot of time on data interpretation and the current version of this article is more about providing the data than doing real analytics. I hope to add more insights in the future.